- EMA trading strategy with stochastic
SKYPE ID = imfxmstr
Moving average is considered as trend identification. Many traders use this indicator for identify and trend. This strategy is made by this EMA and another default stochastic indicator. This is high profitable strategy with low risk. If you can follow the rules of this strategy accurately, then you can get very good result from this strategy.
Required indicators:
1) 100 EMA
2) Stochastic(5,3,3) with horizontal line 80 and 20
How to get signal:
Buy Signal: When market remains above 100 EMA, then it will be considered as uptrend. Now you need confirmation from Stochastic for taking entry. When a crossover occurs below 20 level of stochastic, then you need open buy order. When market price is above 100 EMA, you need to find only buy signal from this strategy.
Sell Signal: When market remains below 100 EMA, then it will be considered as downtrend. When a crossover occurs above 20 level of stochastic, then you need open sell order. When market price is a below 100 EMA, you need to find only sell signal from this strategy.
Time frame: H4 or Daily
Take profit and Stop loss: Take profit should be 70-100 pips in every signal and you can set take profit 1:2 risk ratio. You can set stop loss below 100 EMA for buy signal and set stop loss above 100 EMA for sell signal. If EMA is far away from your entry price, then you can set 50-60 pips stop loss.
Currency pairs: All major and cross pairs.
Risk warning: This strategy is made only for trendy market, do not use this on ranging market. You must follow money management and take 1-2% risk for every trade. For understanding this strategy, you need to practice this on demo account. If you get good result then you can apply this on your real account as your trading strategy. -
SKYPE ID = imfxmstr
>>>>>>>>>>>>>>>>>>>>>>>>>>>>>>>>>>>>>>>>>>>>>>>>>>>>>>>>>>>>>>>>>>>>>>>
London breakout strategy is very profitable intra-day trading system. This strategy can give 30-50 pips everyday from every major pair. Principle of this trading strategy is very simple and easy to use. New traders can make profit from this strategy easily.
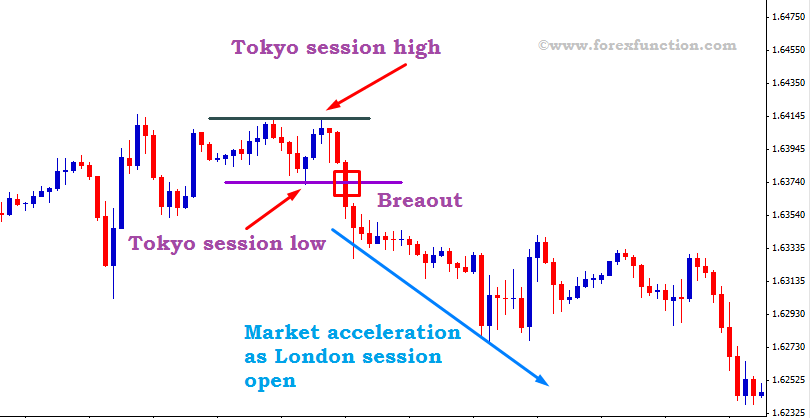
Market usually remains in ranging mode on Tokyo session. London session starts after the end of Tokyo session. Then market acceleration starts and breaks the ranging area.
Strategy requirement:
For this strategy, first you need to determine the ranging area. In the Tokyo session, market will make low and high. You need to draw a horizontal line at the low price, same you need to do for high price like as figure. You just need to wait for breakout at the beginning of the London session. When London session starts, market accelerates sharply. Thus you can take any entry easily from this strategy
How to trade on this strategy:
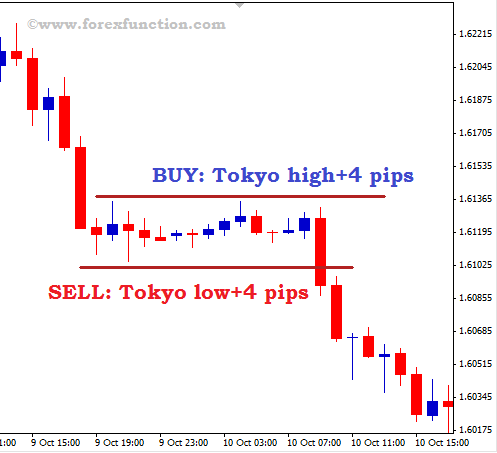
For applying this strategy you need to see the main trend of the pair. If the pair moves in one trend direction, only then you apply this strategy. First you need to mark the ranging area. Then you have to note down the high price and low price between this ranging area. Then you have to set pending buy stop 4 pips above the high price of the ranging zone.
Similarly you need to set sell stop 4 pips below the low price of Tokyo ranging area.
For buy entry, stop loss will be below the Tokyo session low price.
For sell entry, stop loss will be above the Tokyo session high price.
Target will be 1:2 risk ratio for both type of entry.
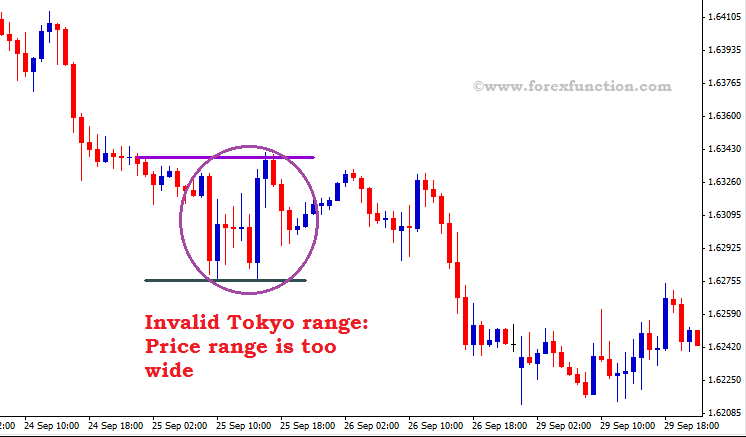
When avoid from this strategy:
If you find wide range in the Tokyo session, then you need to avoid this strategy at that day. This range should be very tight. If you see some volatility in Tokyo session, then you can get false breakout at the beginning of the London session, so in this situation you need to avoid from this strategy.
Currency pairs: All major pairs specially EURUSD, GBPUSD, NZDUSD, AUDUSD, USDCHF, USDCAD, USDJPY.
>>>>>>>>>>>>>>>>>>>>>>>>>>>>>>>>>>>>>>>>>>>>>>>>>>>>>>>>>>>>>>>>>>>>>>>>>>>>
London Breakout Strategy
London breakout strategy is very profitable intra-day trading system. This strategy can give 30-50 pips everyday from every major pair. Principle of this trading strategy is very simple and easy to use. New traders can make profit from this strategy easily.
Market usually remains in ranging mode on Tokyo session. London session starts after the end of Tokyo session. Then market acceleration starts and breaks the ranging area.
Strategy requirement:
For this strategy, first you need to determine the ranging area. In the Tokyo session, market will make low and high. You need to draw a horizontal line at the low price, same you need to do for high price like as figure. You just need to wait for breakout at the beginning of the London session. When London session starts, market accelerates sharply. Thus you can take any entry easily from this strategy
How to trade on this strategy:
For applying this strategy you need to see the main trend of the pair. If the pair moves in one trend direction, only then you apply this strategy. First you need to mark the ranging area. Then you have to note down the high price and low price between this ranging area. Then you have to set pending buy stop 4 pips above the high price of the ranging zone.
Similarly you need to set sell stop 4 pips below the low price of Tokyo ranging area.
For buy entry, stop loss will be below the Tokyo session low price.
For sell entry, stop loss will be above the Tokyo session high price.
Target will be 1:2 risk ratio for both type of entry.
When avoid from this strategy:
If you find wide range in the Tokyo session, then you need to avoid this strategy at that day. This range should be very tight. If you see some volatility in Tokyo session, then you can get false breakout at the beginning of the London session, so in this situation you need to avoid from this strategy.
Currency pairs: All major pairs specially EURUSD, GBPUSD, NZDUSD, AUDUSD, USDCHF, USDCAD, USDJPY.
>>>>>>>>>>>>>>>>>>>>>>>>>>>>>>>>>>>>>>>>>>>>>>>>>>>>>>>>>>>>>>>>>>>>>>>>>>>>
Triple EMA crossover trading strategy with Parabolic SAR
EMA crossover is common forex trading strategy. This strategy is developed with 3 EMA with parabolic SAR. This strategy can give more accurate signals. Everyday you can gain 90-100 pips from this strategy from all major pairs. For trendy market, this strategy is very profitable.
Required Indicators:
1) EMA 10
2) EMA 25
3) EMA 50
4) Parabolic SAR
How Signals come:
Buy signal: When EMA 10 crosses EMA 25 from lower to upper and then go through EMA 50 as shown in fig. For confirmation, parabolic SAR should be below the price. After crossover, you have to make sure that Parabolic starts dots in the up direction, then you can open buy entry.
Sell signal: When EMA 10 cross EMA 25 from upper to lower and then go through EMA 50 as shown in fig. For confirmation, parabolic SAR should be above the price. After crossover you have to make sure that parabolic starts dots in the down direction. Then you can open sell entry

Time frame: H1 or above.
Stop loss and take profit: Stop loss will be some pips above the recent swing high(for sell entry) and some pips below the recent swing low(for buy entry). You can close when alternative crossover occurs. Take profit should be 1:2 risk ratio. You can set trailing stop also.
Currency pair: All types of major and cross pairs -
>>>>>>>>>>>>>>>>>>>>>>>>>>>>>>>>>>>>>>>>>>>>>>>>>>>>>>>>>>>>>>>>>>>>>>>>>>>>>>>>>
Forex trading strategy with EMA, Parabolic SAR and RSI
This strategy is combined with 3 mt4 default indicators such as parabolic SAR, EMA and RSI. For trendy market, this strategy is very profitable. By following this strategy, you can make profit easily. As this strategy is made with 3 important indicators, this strategy has good success rate.
Required indicators:
1) Parabolic SAR
2) 100 EMA
3) RSI (Relative Strength Index)
How to get Signal:
Buy Signal: Price must be above 100 EMA. Candle needs to close above 100EMA. RSI needs to close above 50 Level from lower to upper. Parabolic SAR jumps on price at the same time and it starts dots in the up direction. When these three conditions will be fulfilled, then this strategy will give buy signal.
Sell Signal: Price must be below 100 EMA. Candle needs to close below 100EMA. RSI needs to close above 50 Level from upper to lower. Parabolic SAR jumps on price and it starts dots in the down direction. When these three conditions will be fulfilled, then this strategy will give buy signal.

Time frame: H1 or above.
Stop loss and take profit: Stop loss will be some pips above the recent swing high(for sell entry) and some pips below the recent swing low(for buy entry). Take profit should be 1:2 risk ratio. You can set trailing stop also.
Currency pair: All types of major and cross pairs.
Stop loss and take profit: Stop loss will be some pips above the recent swing high(for sell entry) and some pips below the recent swing low(for buy entry). Take profit should be 1:2 risk ratio. You can set trailing stop also.
Currency pair: All types of major and cross pairs.
>>>>>>>>>>>>>>>>>>>>>>>>>>>>>>>>>>>>>>>>>>>>>>>>>>>>>>>>>>>>>>>>>>>>>>>>>>>>>>>>>
Forex trading strategy of 3 EMA crossover
There are many strategies with EMA(Exponential Moving Average of the close price) crossover. This strategy is made by 3 EMA and with their crossover. Triple EMA crossover is very simple and profitable forex trading strategy. This strategy is suitable for trendy market. New traders can use this system. If you can follow this trading strategy with proper rules and money management then it may gives 80-100 pips daily.
Required Indicators:
1) EMA 5(fast)
2) EMA 10(medium)
3) EMA 14(slow)
Signals:
Buy signal: When fast EMA 5 cross medium EMA 10 from lower to upper and then go throough EMA 14 as shown in fig, then take buy entry.
Sell signal: When fast EMA 5 cross medium EMA 10 from upper to lower and then go through EMA 14 as shown in fig, then take sell entry.

Time frame: H1 or H4.
Stop loss and take profit: Stop loss will be some pips above the recent swing high(for sell entry) and some pips below the recent swing low(for buy entry). Take profit should be 1:2 risk ratio. You can set trailing stop also.
Currency pair: All types of major and cross pairs.
Stop loss and take profit: Stop loss will be some pips above the recent swing high(for sell entry) and some pips below the recent swing low(for buy entry). Take profit should be 1:2 risk ratio. You can set trailing stop also.
Currency pair: All types of major and cross pairs.
>>>>>>>>>>>>>>>>>>>>>>>>>>>>>>>>>>>>>>>>>>>>>>>>>>>>>>>>>>>>>>>>>>>>>>>>>>>>>>..
Forex trading strategy of EMA with CCI
EMA is very common tools to all traders. There are many strategies by EMA. This strategy is very simple and easy to find trading opportunities for all kind of traders. New traders do not need any analysis for applying this strategy. They need to follow the rules of this strategy and they earn pips easily.
Strategy requirement:
You need to set-up the chart manually for this strategy. You need three mt4 default indicator:
1. 80 EMA (Exponential Moving Average of the close price)
2. 40 EMA (Exponential Moving Average of the close price)
3. CCI-14 period (Commodity Channel Index)
System rules:
1st rule: You can only find buy opportunities when 40 EMA is above the 80 EMA. Similarly you can find sell entry when 40 EMA is below the 80 EMA.
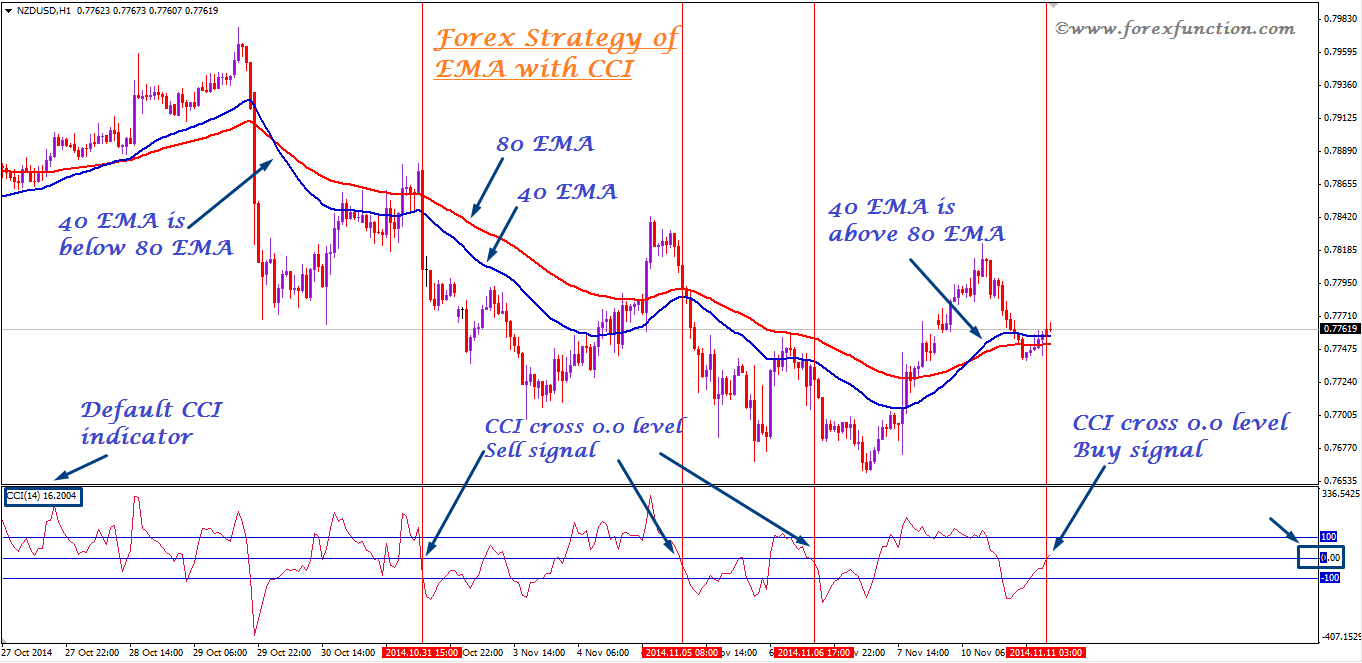
2nd rule: If you trade on H1 time frame or below this time frame, then it will be consider as intra-day trading. For trading with lower time frame, you need to find buy/sell opportunities in the London and US session. If you trade on H4 time frame, then session is not any fact. You can trade anytime when you will get any signal.
3rd rule: The third is how you will find signal from this strategy.
Buy signal: When 40 EMA is above the 80 EMA, you can take buy when CCI cross 0.0 level from below to above.
Sell signal: When 40 EMA is below the 80 EMA, you can take sell entry when CCI cross 0.0 level from above to below.
3rd rule: The third is how you will find signal from this strategy.
Buy signal: When 40 EMA is above the 80 EMA, you can take buy when CCI cross 0.0 level from below to above.
Sell signal: When 40 EMA is below the 80 EMA, you can take sell entry when CCI cross 0.0 level from above to below.
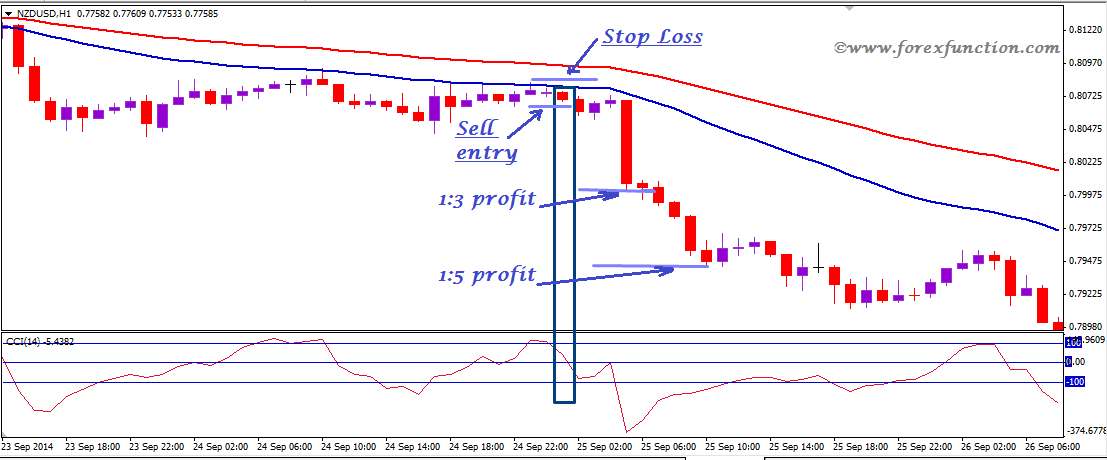
Stop loss and take profit: Stop loss will be based on your time frame. If you use lower time frame, then you can use 20-30 pips stop loss. For higher time frame, you can set 50-60 pips stop loss. Take profit should be 1:2 risk ratio. Sometimes you can get 1:5 risk ratio from this trading strategy.
Currency pair: All types of major and cross pairs.
Currency pair: All types of major and cross pairs.
>>>>>>>>>>>>>>>>>>>>>>>>>>>>>>>>>>>>>>>>>>>>>>>>>>>>>>>>>>>>>>>>>>>>>>>>>>>>>>>.
Forex chart pattern trading on Wedge Pattern
Wedge pattern
The wedge pattern is one of the common chart pattern in the technical analysis. This pattern is used mainly as reversal pattern. Sometimes it can indicate continuation of any trend. Wedge pattern is like as channel pattern but there is some difference between these patterns. In channel, price rally in parallel way, in wedge, price comes close at the end of this pattern.
bWedge patterns are two types:
1. Rising wedge pattern
2. Falling wedge pattern
Rising wedge pattern
Rising wedge pattern is found in the uptrend market. It is used as reversal pattern which gives bearish signal. This pattern is made by two rising trend line.
How it forms:
>> It occurs on at the top of the market.
>> It makes higher highs and higher lows.
>> Price movement becomes slow.
>>Price comes closer at the top of this pattern.
>>It combined with two rising trend lines.
>>Upward momentum becomes slow

How to trade on rising wedge pattern:
When price momentum becomes slow then sellers take preparation for getting sell confirmation. Bearish signal comes when price breaks lower rising trend line. Breakout of this pattern can be confirmed by volume indicator. After successful breakout it indicates for bearish signal. Success rate is very high in this pattern. Take profit can be set as 1:3 risk ratio. Stop loss need to set above the top of this pattern.
Falling wedge pattern
Falling wedge pattern is usually found in the downward market. It is normally used as reversal pattern which gives bullish signal. This pattern is made by two downward trend line.
How it forms:
>> It occurs on at the low of the downward market
>> It makes lower lows and lower highs for 2-3 times.
>> Price rally becomes slow at the end of the pattern.
>> Price comes closer at the low of this pattern.
>> It combined with two downward trend lines.
>> Downward momentum becomes slow.

How to trade on falling wedge pattern:
When price momentum becomes slow at the end of this pattern, market tries to go up. Bullish signal comes when price breaks upper trend line. After successful breakout it indicates for bullish signal. Success rate is very high in this pattern. Take profit can be set as 1:3 risk ratio. Stop loss need to set below the low of this pattern.
When price momentum becomes slow at the end of this pattern, market tries to go up. Bullish signal comes when price breaks upper trend line. After successful breakout it indicates for bullish signal. Success rate is very high in this pattern. Take profit can be set as 1:3 risk ratio. Stop loss need to set below the low of this pattern.
>>>>>>>>>>>>>>>>>>>>>>>>>>>>>>>>>>>>>>>>>>>>>>>>>>>>>>>>>>>>>>>>>>>>>>>>>>
Forex chart pattern trading on double top and double bottom
Double Top:
Double Top is very the most common chart pattern in Forex market. It is used as a reversal pattern. This pattern is very profitable and its success rate is high. This pattern is named for its formation with two double top on the upward market. It is a bearish reversal signal. It occurs in the upward market. There are two parts in this chart pattern, these are 2 tops and Neckline.
How it forms:
>> First it creates higher high in the upward market and it can act as resistance level.
>> Then it falls from higher high for few pips.
>> Again price moves to the same high as like first top.
>> It can’t break that level and falls again to the support at neckline.
>> A neckline should be drawn from the low of the top.

How to Trade on this pattern
Neckline acts as a support line. So it requires to wait for breakout of the neckline. After successfully breakout this pattern gives bearish signal. From the retest of the neckline, sell entry can be taken.
Stop loss will be some pips above higher high. Target should be at least 1:1 risk ratio. Target can be set equal to the distance from neckline to the higher high.
Triple Top
Triple top is same as double top but difference is only that in this pattern it creates 3 tops. Everything is same as double top and need to follow same rules for taking entry.

Double Bottom
Double Bottom chart pattern gives a bullish reversal signal which occurs in the downward market. It has similar formation but inverse formula like double top. There are also two parts in this pattern, these are 2 bottoms and Neckline.
How it forms
>> At first it creates lower low in the downward market and it can act as support level.
>> Then it returns from lower low for few pips.
>> Again price falls to previous low as like first bottom.
>> It can’t break that support level and again starts to raise to the resistance at neckline.
>> A neckline should be drawn from the high of the bottom.

How to Trade on this pattern:
Neckline acts as a resistance line in double bottoms. So it requires to wait for breakout of the neckline. After successfully breakout this pattern gives bullish signal. From the retest of the neckline, buy entry can be taken.
Stop loss will be some pips below the lower low. Target should be at least 1:1 risk ratio. Target can be set equal to the distance from neckline to lower low.
Triple Bottom:
Triple Bottom is same as double bottom but difference is only that in this pattern it creates 3 bottoms. Everything is same as double bottom and need to follow same rules for taking entry.

>>>>>>>>>>>>>>>>>>>>>>>>>>>>>>
Forex trading contrivance with head and shoulders pattern
The head & shoulders pattern is very common and popular chart patterns. It is a reversal pattern. Usually day and swing traders use this pattern for taking any reversible entry and this pattern is very profitable and success rate is high. This pattern is named for its formation with two shoulders and one head.
This pattern is two types:
1. Head & Shoulders in upward market,
2. Invert Head and Shoulder in Downward market.
Head & Shoulders in upward market:
Head & Shoulders chart pattern gives a bearish reversal signal. It occurs in the upward market. There are four parts of this pattern, these are Left shoulder, Head, Right shoulder, Neckline.
How it forms:
>> First it creates left shoulder in the upward market, then decline from that.
>> Then it goes higher than left shoulder and form head at the top of the market.
>> Then Price falls from head and comes to the support.
>> Again it raise little to create right shoulder.
>> Then it falls to the support at neckline.
>> A neckline should be drawn from the low of two shoulders.
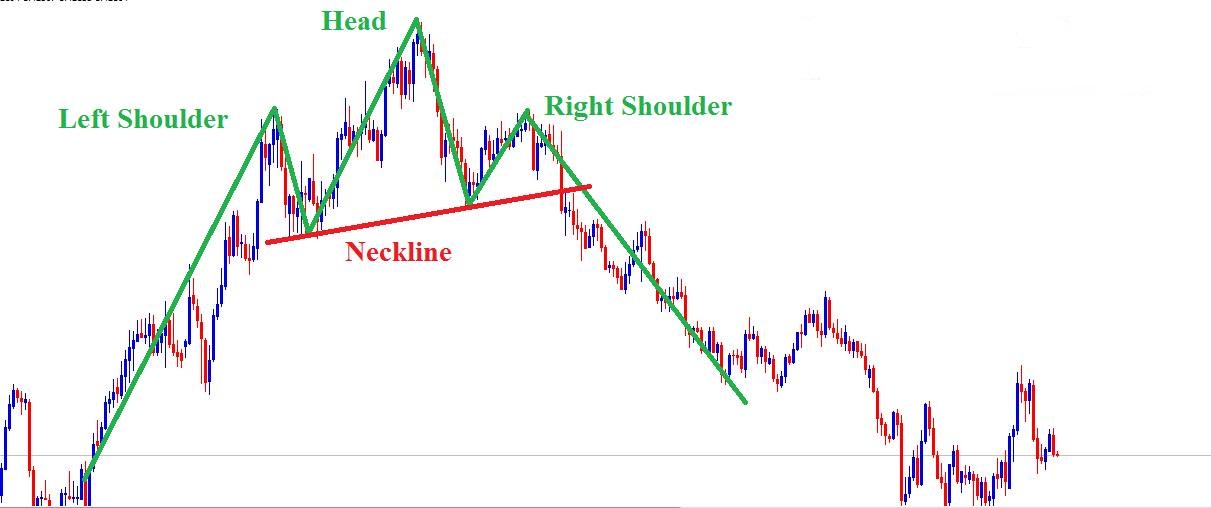
How to trade on head and shoulder pattern:Neckline acts as a support line. So it requires to wait for breakout of the neckline. After successfully breakout this pattern gives bearish signal. From the retest of the neckline, sell entry can be taken.
Stop loss will be some pips above the right shoulders. Target should be at least 1:2 risk ratio. Target can be set equal to the distance from neckline to Head show in the above fig
Invert Head and Shoulder in Downward market
Invert Head & Shoulders chart pattern gives a bullish reversal signal which occurs in the downward market. It has similar formation but inverse formula like normal head & Shoulders. There are also four parts in this pattern, these are Left shoulder, Head, Right shoulder, Neckline.
How it forms:
>> At first it creates left shoulder in the fully downward market, then moves up from that shoulder.
>> Then it declines lower from left shoulder and form lower low at the bottom of the market.
>> Then Price moves up from head and goes to the near term resistance
>> Again it falls little to create right shoulder.
>> Then it starts to moves high to the neckline
>> A neckline should be drawn from the low of two shoulders.

How to trade on invert head and shoulder pattern:
Neckline acts as a resistance line in the invert head & Shoulders. So it requires to wait for breakout of the neckline. After successfully breakout this pattern gives bullish signal. From the retest of the neckline, buy entry can be taken.
Stop loss will be some pips below the right shoulders. Target should be at least 1:2 risk ratio. Target can be set equal to the distance from neckline to Head show in the above fig.
>>>>>>>>>>>>>>>>>>>>>>>>>>>>>>>>>>>>>>>>>>>>>>>>>>>>>>>>>>>>>>>>>>>>>>>>>>>>>>>>>
EMA crossover and RSI simple trading strategy
There are a lot of trading strategy including Exponential Moving Average (EMA) and Relative Strength Index (RSI) but this one is simple, effective and most powerful. If you can follow this trading strategy strictly with suitable money management then it may gives 75-100 pips daily.
Strategy:
Required Indicators:
1) EMA 6
2) EMA 12
3) RSI ( Period 14; level: 50; fixed Minimum:0; Fixed Maximum: 100 )
You may download the full template for this trading strategy from the following link: Download Here
How to setup a Forex Template:
Extract the template > Copy the Template >Open your mt4 terminal > Click files > Click "open data folder"> Click Templates> Paste the Template )
Sessions: Especially EUROPE and LONDON Cross.
Currency Pairs : All of the major currency pair especially USDJPY, EURJPY, GBPUSD, EURUSD, USDCHF, AUDUSD, NZDUSD etc.
Time Frame: 1H and scalper can use 30M time frame.
SIGNALS:
BUY: When the EMA 6 cross the EMA 12 and at the same time RSI cross 50th level from lower to upper as shown in following figure: -

SELL: When the EMA 6 cross the EMA 12 and at the same time RSI cross 50th level from upper to lower as shown in following figure.

Money Management:
This is day and short time trading strategy. So keep take profit 30-50pips with stop loss 30-50pips for 1:1 risk reword ratio. It may also depend on your trading style. So before applying this strategy on real account, practice at least 1 month on demo account for better purpose.
Risk Warning:
Any strategy may not perfect if you can’t manage it properly. So don’t be hurry up to open a trade when you get buy or sell signal, wait for the next candle for getting more good results.
>>>>>>>>>>>>>>>>>>>>>>>>>>>>>>>>>>>>>>>>>>>>>>>>>>>>>>>>>>>>>>>>>>>>>>>>>>>>>>.
Forex News Trading Insight
Economic news are released regularly on the basis of cycles and these news are published by Forex related websites on economic calendar section. Forexfactory, Investing etc sites are popular for publishing economic news because they have biggest agency like Bloomberg, CNBC, Reuters etc.
For fundamental analysis economic news are very vital because when a news is released market moves over 40-50pips within few minutes. Every news may not equally important as price movements are not same on each news . High impact news can move the price more than the medium impact or low impact news .
There are three types of data value in the economic calendar such as
i) Previous value
ii) Forecast Value
iii) Actual Value
Previous Value:
Economic news ( i.e GDP, Interest Rate, Retails Sells etc) of a country are published in a cycle such as US Non-Firm Payroll news published every month within first week, UK prelim GDP published every three months. So previous data show the past actual economic data value.
Forecast Value:
Forecast value is not a actual data value as it is the estimate value of guessing by the greatest economist with respect to the current economic variable or growth of a specific country.
Actual Value:
Actual value shows the current data value of a economic news. If the actual value will comes bad than the forecast value that means the economy growth is going to down. So the general rules are-
Actual Value > Forecast Value = Good For currency
Actual Value < Forecast Value= Bad for currency
Notice that it may be vice -versa for some specific economic news such as Unemployment Rate.
See average pips movement with USA, CANADA, EUROPE, UK, AUSTRALIA and NEWZEALAND economic news by the following links
1.United States of America(USA) Economic Report Influence On Forex Market
2.CANADA Economic Report Influence On Forex Market
3.EUROPEAN Economic Report or News Influence On Forex Market
4.United Kingdom (UK) Economic Report Influence On Forex Market
5.AUSTRALIA Economic Report Influence on Forex Market
6.NEW ZEALAND Economic Data Report Influence on Forex Market
>>>>>>>>>>>>>>>>>>>>>>>>>>>>>>>>>>>>>>>>>>>>>>>>>>>>>>>>>>>>>>>>>>>>>>>>>>>>>>>>>
How to Trade in Forex by Candlesticks Pattern Analysis
At first we should know what is technical analysis?
Technical analysis is the practical price action that may help you to make a buy and sell decision. Most technical analysis are done using charts with different pattern and chart bar. So technical analysis are sometimes called chartist. Fundamental analysis ( market economic analysis) are always basis of technical analysis hence fundamental analysis always scorn from technical analysis. So it may be said that technical analysis is more important than fundamental analysis.
Why we should use candlesticks pattern:
Without any doubt we know that candlesticks pattern is the most popular chart pattern among bar charts and line charts and 90%-95% trader use it for their easy technical analysis .Most of the time market move based price action and to understand it candlesticks chart patterns are very vital.
From candle sticks pattern we can get “pinbar” which is most relevant pattern that help to understand the market movement easily. Basically if pinbar reject important price movement level then market move in inverse direction. But it is not right that every pinbar will work 100%! so we need to understand the correct and suitable pinbar to be mastered in forex .
Here I am going to discuss most important candlesticks pattern which help you to understand the price action strategy of the market properly and to make right trading decision.
Basic Bullish and bearish Candlesticks Patterns:

Here you see bullish and bearish candlesticks chart pattern. In where bullish chart patterns opened at lower and closed at higher that means buyer are coming . For the bearish candlesticks pattern is open at higher and closed at lower which means sellers are coming.
Basic bullish and bearish Candlesticks pattern’s pinbar:
Basic bullish and bearish Candlesticks pattern’s pinbar:

i) The bullish pinbar refers that the market should be bullish because its body in the upper side and tail in the lower side.
ii) For bearish pinbar give the region to be downtrend and here sellers are coming with more energy which is indicated as the tail are upper level and body is the lower level.
Different Types of candlesticks pattern study :
The name of the candlesticks patterns are come from interesting words and I am going to describe these with easy language and shortly.
# Hammer:

i)This pinbar give bullish signal of the market price and it comes after a long down trend.
ii) The range of closing and opening price is small and it’s body may be green or red. So when you see this pinbar then you can make a decision for BUY.
In a words it shows that-
<-buyers .="" are="" comming="" in="" nbsp="" span="">
-buy when price close above high of hammer.
- give stop loss below hammer.
# Hanging Man:

( i) This pinbar is same to the hammer but it comes from after a significant uptrend.
(ii) When hanging man pinbar is found you can make a SELL decision with proper analysis.
(ii) When hanging man pinbar is found you can make a SELL decision with proper analysis.
##Doji :

i) The doji comes when price opened and closed at the same position.
ii) There are four kinds of doji candlesticks patterns these are star doji, gravestone doji, dragonfly doji, fourprice doji. These are the most significant pinbar and help to make you correct decision to enter the market.
iii) When doji comes after a significant down trend then you can make a BUY decision and when it comes after a up trend then you can make sell decision.
Shooting Star:

(i)It comes after a long bullish trend these means buyers are going out and sellers are coming.
(ii)You can make a SELL trade when price close below the shooting start candlesticks pattern.
(iii)Put tight stop loss at the above of shooting star.
(ii)You can make a SELL trade when price close below the shooting start candlesticks pattern.
(iii)Put tight stop loss at the above of shooting star.
Morning Star:

i) It may form after a short down trend. The higher it has low higher shadow and low lower shadow.
ii) The opening and closing price may close . It might be bullish after the bearish candlesticks pattern.
iii) It may help you for opening a BUY trade as buyers are starting to come in the market.
ii) The opening and closing price may close . It might be bullish after the bearish candlesticks pattern.
iii) It may help you for opening a BUY trade as buyers are starting to come in the market.
Evening Star:

i) Evening star is just opposite to the morning star candlesticks pattern. It means that the buyers are going out from the market and sellers are beginning to enter the market
ii) It is a bearish pinbar so it might help you to make a SELL trade.
ii) It is a bearish pinbar so it might help you to make a SELL trade.
Bullish Engulfing:

i) Bullish Engulfing comes from the pure downtrend and sellers get trapped as more buyers are coming with more energy.
ii) If may help you to make buy decision if the next candle closed at uppers level compare this bullish candle.
ii) If may help you to make buy decision if the next candle closed at uppers level compare this bullish candle.
Bearish Engulfing:

(i)This is another bearish candlesticks pattern and it may opens after a gave pattern.
(ii)If it formed at the resistance level then you can make a decision for SELL.
(ii)If it formed at the resistance level then you can make a decision for SELL.
Dark Cloud Cover:

i) After a bullish candlesticks pattern if the red candle or bearish candle opens at higher then bullish candle and end closed at the lower compare of bullish candle than dark cloud cover candlesticks pattern is formed , you can make a decision for SELL.
ii) open make a quick decision for SELL you can wait for the next candle for confirmation.
ii) open make a quick decision for SELL you can wait for the next candle for confirmation.
Harami:

i) When the bearish candlesticks pattern is opened lower compare to the bullish pattern and closed at the upper level then harami or bearish pattern is formed .
ii) This candle can help you for making a SELL decision at the resistance level.
ii) This candle can help you for making a SELL decision at the resistance level.
>>>>>>>>>>>>>>>>>>>>>>>>>>>>>>>>>>>>>>>>>>>>>>>>>>>>>>>>>>>>>>>>>>>>>>>>>>>>>>>>>
Important fibo-retrenchment levels for Fibonacci trading
Fibo Retracement is an important tool for analyzing the Forex market and many trader use it as an indicator for finding the proper entry and exit point with stop loss of their trading. But many may don’t know which fibo level may be vital in different time frame. So this article will be very helpful for you to find a good level for your fibonacci trading in different time frame and different market sentiment.
Generally the important Fibonacci levels are 23.6%, 38.2%, 50%, 61.80%
# Fibonacci level 38.5% and 61.8% works good at 1Hour, 4Hours time frame .
# Fibonacci level 23.6% and 38.2% are most important at daily time frame
# Fibonacci level 38% and 50 % works good at weekly time frame .
# Fibonacci Level level 38% and 50 % works good for Gold and Silver Trading with 4hours, daily and weekly time frame.
#In a strong Trend you may chose fibo level 61% for proper analyzing.
But you always consider your risk reword ratio and hence you should use take profit and stop loss point and it will be base your trading style short time trading or long time trading. If you enter the market at 38% fibo level then you may take profit at 61.8% with stop loss at the below 23.6% but it will depend on your trading plan
>>>>>>>>>>>>>>>>>>>>>>>>>>>>>>>>>>>>>>>>>>>>>>>>>>>>>>>>>>>>>>>>>>>>>>>>>>>>.
Trendline trading system with MACD
Trendline is a powerful trading tools for the traders. This trading system is based on trendline breakout. It is combined with MACD which can give you more accuracy for taking entry. This trading system is very simple which is suitable for professional and beginners.
How to take Buy entry
You need to draw a up trendline. You have to draw trendline by joining the swing low in the up trend market. You should not draw any line over the candle. After drawing trendline, you have to wait for breakout of this up trendline. When it breaks trendline, then you need to wait for getting confirmation from MACD. At the time of breakout, MACD should be over 0.0 level. If MACD is above 0.0 level, then you can take buy entry.
How to take Sell entry
You need to draw down trendline. You have to draw down trendline by joining the swing high in down trend market. You have to wait for breakout for taking sell entry. When it breaks down trendline, then you have to check MACD. If MACD is below 0.0 level at the same time, then you can take sell entry.

Time frame:H1, H4 and Daily
Take profit and Stop loss:You can set take profit 40-50 pips for H1 time frame. If you get signal from H4 and daily time frame, then you can set take profit more than 100 pips. You can set stop loss 40 pips for H1 time frame. For H4 and daily, stop loss should be 50-70 pips.
Take profit and Stop loss:You can set take profit 40-50 pips for H1 time frame. If you get signal from H4 and daily time frame, then you can set take profit more than 100 pips. You can set stop loss 40 pips for H1 time frame. For H4 and daily, stop loss should be 50-70 pips.
>>>>>>>>>>>>>>>>>>>>>>>>>>>>>>>>>>>>>>>>>>>>>>>>>>>>>>>>>>>>>>>>>>>>>>>>>>>>>>>>>
No comments:
Post a Comment
Note: only a member of this blog may post a comment.